Decarbonising Greenwich’s homes - a look at EPC data
- greenwichclimatene
- Apr 6, 2024
- 4 min read
What are EPCs?
Residential properties are the largest source of greenhouse gas emissions in the borough, accounting for around 40% of all emissions in 2021.
To find out how much progress we’re making GGCN thought we’d look at the publicly available EPC data provided for download by the government.
EPC is short for “Energy Performance Certificate”. This certificate gives a home a performance rating from A to G, where a rating of A means your home is one of the best performing, and G means it’s one of the worst performing.
You are required to get an EPC if you are selling or renting a residential property. Data from EPCs is aggregated at national, regional and local authority levels, and published on a quarterly basis on the government’s website. Looking at this data should give us an idea of how the energy efficiency and carbon footprints of homes in Greenwich are trending over time, and compare progress to Greenwich council’s stated targets.
Would you like to see the EPC for your home? Unexpectedly, all EPCs are available online. You just need to search by postcode. A little tip, If your home doesn’t have an EPC, and you are curious, you may be able to get some idea by looking at homes you know are similar to yours in your postcode, or neighbouring postcodes.
Energy Performance Ratings
Let’s first look at the performance ratings data. Here it should be noted that the performance ratings are calculated based on how much money it takes to run the house per square metre. Often a good performance rating means a low carbon footprint, for example a house with lots of insulation will be both cheaper and greener. But this isn’t always the case, and we’ll discuss this in more detail later.
With EPCs we generally see that new builds are a lot more efficient than existing homes. For this reason, the EPC data is broken down by new builds and existing builds.
This chart shows the how the EPC ratings has changed over time for existing builds:

In the above you can see that the EPC ratings for Greenwich’s existing homes have been gradually improving since 2008. The number of homes rated in the worst categories of E, F and G have decreased.
Here is the same chart, except for new builds rather than existing ones. It shows that new homes in Greenwich usually have high performance ratings. However, occasionally some new builds have ratings of D or lower. To put this into perspective, my 1930s built home with solid brick walls and just loft insulation, has a D rating, and I definitely find it costly to run. I’d be disappointed if a new build cost a similar amount.

A good performance rating doesn’t mean a low carbon footprint
As mentioned before, a good performance rating doesn’t necessarily mean that a house has a low carbon footprint. This is because the rating is about how much it costs your home to run, and not its greenhouse gas emissions.
If you switched from a gas boiler to a heat pump, you would dramatically cut your carbon footprint, as the heat pump would use around a third of the energy to generate the same heat. However, a lot of energy tariffs price electricity at around three times the cost of gas. This means you won’t have particularly improved your EPC performance rating by switching. The situation will only become more pronounced as the electricity grid continues to decarbonise.
Carbon Footprints
Luckily for us, carbon emission estimates are also collected as part of an EPC. The emissions are estimated by looking at the type of heating you have, and the features of the home you have (How big is it? is it a terrace?, does it have roof insulation?). These are used to calculate your energy use, if you were to behave like a “standard” occupant. They then use a set conversion factor for each type of fuel to calculate an emission estimate.
This means that your estimated emissions may not match your real emissions. You may be someone who wears more jumpers when they’re cold, rather than turning on the heating, or you may follow the National Grid’s carbon intensity dashboard and strive to use electricity during times when it will generate fewer emissions. In both cases your home’s carbon footprint will be lower than the one on your EPC. The estimated carbon emissions from EPCs gives a picture of the carbon efficiency of the fabric of our homes. This bar chart shows how estimated carbon emissions have changed over time for both new and existing homes in Greenwich.

There is a reassuring downwards trend for existing homes. New builds look to have pretty low emissions.
You may be thinking that the vast difference between new and existing builds is down to new builds being a lot smaller. The floor size of homes is collected as part of the EPC, and so we can compare the size of new and existing builds. It turns out new builds are only a bit smaller on average. (70m2 is about 750 sq. ft. and 80m2 about 860 sq. ft.)

How does Greenwich compare to others?
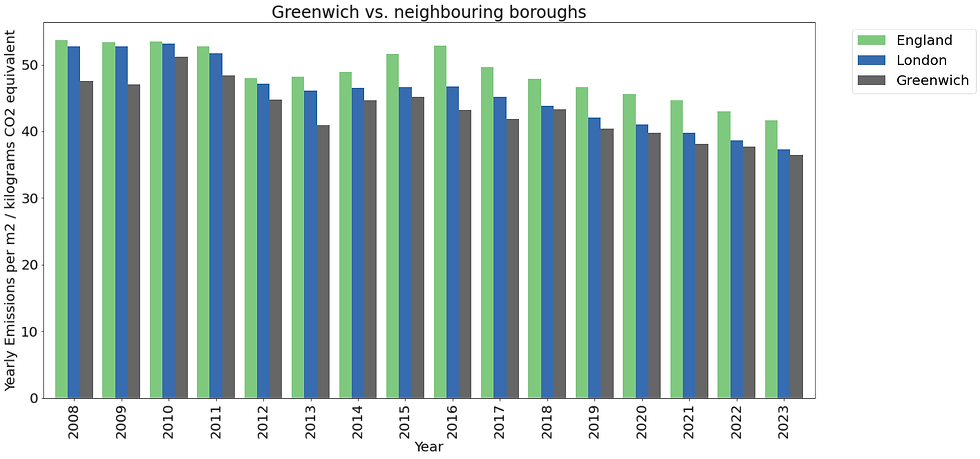
Greenwich is doing comparatively well compared to England and London. This graph shows the average estimated greenhouse gas emissions per m2 of floor space, for existing homes, in England, London and Greenwich. Greenwich is consistently lower.
This shows how the greenhouse gas emissions per m2 of floor space in Greenwich for new builds compares to that in the neighbouring boroughs of Bromley, Bexley, Lewisham and Tower Hamlets; again Greenwich is consistently lower.

How will things look in the future?
The following graph shows how the estimated CO2 emissions per m2 of existing residence in Greenwich may look in the future, if it continues to follow its current trend.

Given the current trajectory, Greenwich would be on track to go from emissions of around 40 kg to 32.5 kg, which is a drop of just under 20%. Given residential properties account for 40% of the borough’s emissions, when translated to the total amount of emissions for Greenwich, this would be an 8% drop.
However, the electricity grid has been decarbonising, and could potentially decarbonise quite rapidly before 2030. So I intend to look at the actual gas and electricity consumption for our borough in my next blog post.
Emily, GGCN


Comments